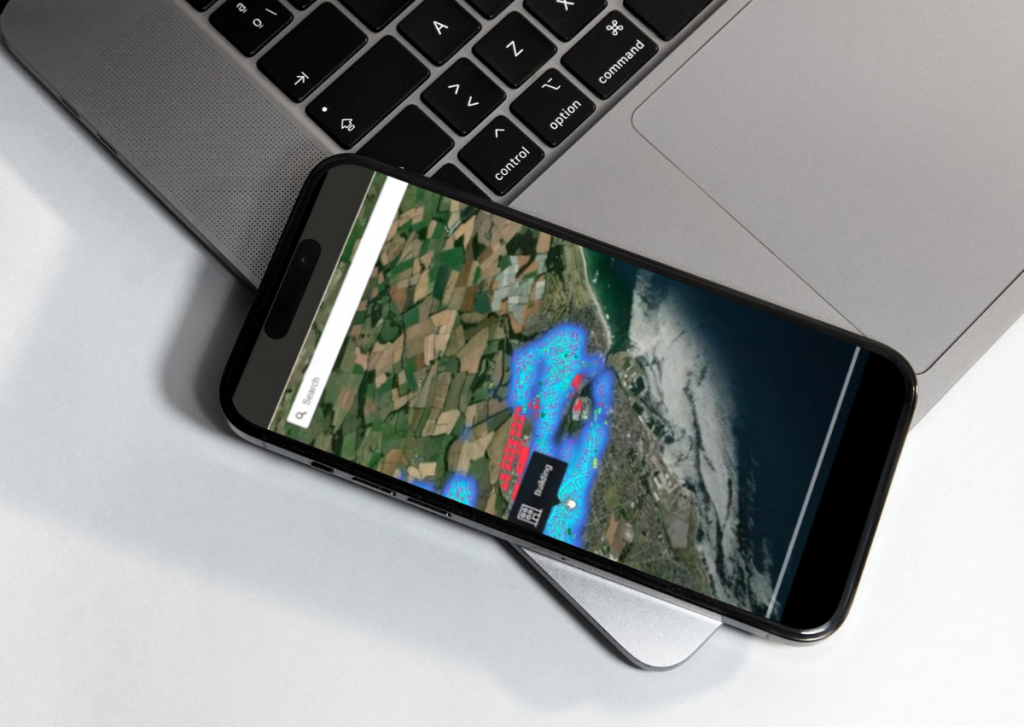
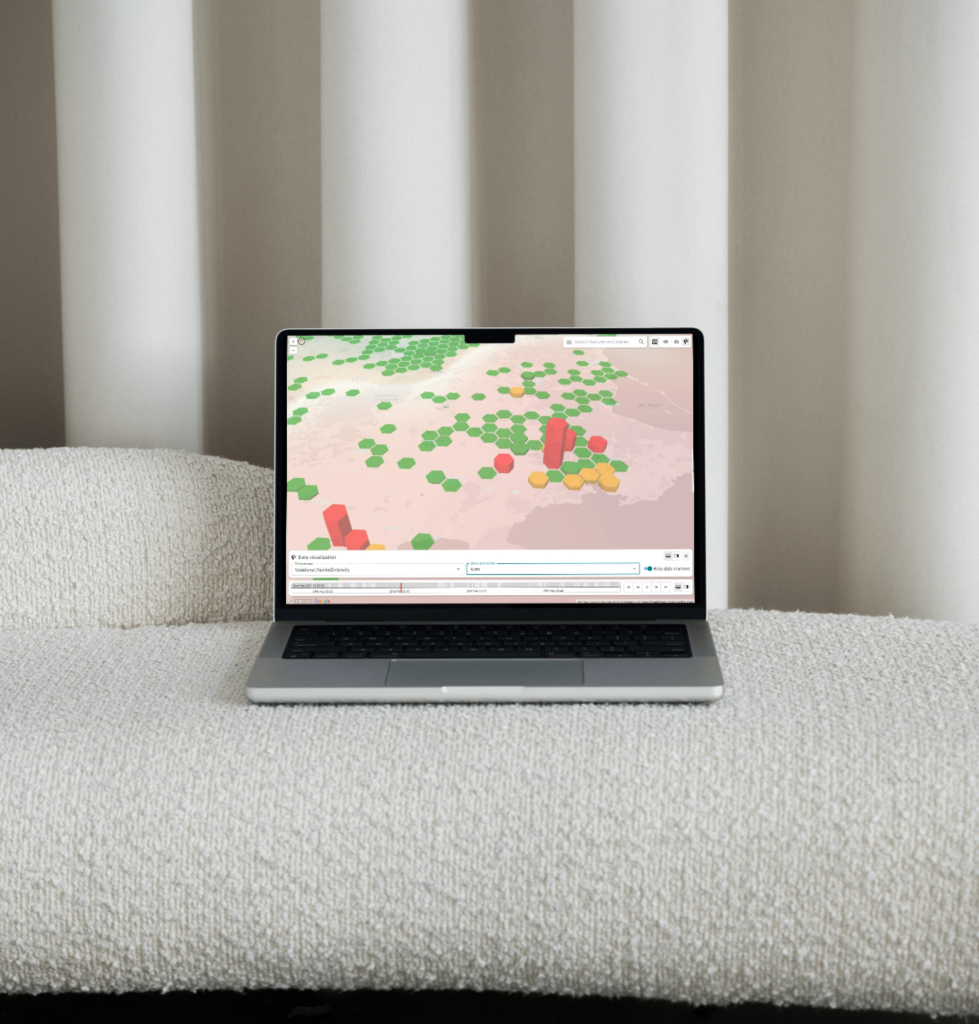
DATA VISUALISATION
Active Maps presents your data in user-friendly formats such as 3D graphs, charts, time-based tables and camera feeds
SOME OF THE DATA SOURCES WE INTEGRATE WITH
![]()
![]()
![]()

![]()
![]()
next level data visualisations
REAL-TIME DATA
Data is streamed in real-time, view live CCTV camera footage, receive traffic alerts and notifications or traffic light your car-park capacity systems – view all of this in a single screen.
DATA ANYWHERE ON ANY DEVICE
Access your data anywhere, on any device. Collaborate across your team on the move by creating custom dashboards for your different teams and stakeholders to access and discuss.
QUICKER, SMARTER DECISIONS
Combining data, sharing it across a wider team and generally making it more accessible to the people who need it allows for greater collaboration, smarter and swifter decisions.
data that makes sense
Make sense of diverse and combined data, with geospatial context, for non-GIS specialists and for organisation unable or unwilling to invest time and money in more expensive GIS software and in-house experts.
Active Maps speeds up and simplifies the job of combining and analysing data – making it more accessible to a range of project stakeholders
a single source of information
The future of smart places lies in creating a common IT infrastructure and platforms that can be utilised by multiple applications. This is where Active Maps plays a crucial role. Being sensor agnostic means we can bring different data sets together and combine them on a single map layer to give you the full picture – not just part of it. Translate raw data into insight.
Having a holistic view of your data enables you to easily identify trends, spot anomalies and communicate what you find. Active Maps truly enables you to understand what is happening, where it is happening and most crucially, why.